Month End Review Dashboard
Executives and managers use the Month End Review Dashboard (also known as the Performance Reporting dashboard) to easily view variances between the month/YTD plan versus actual for the organization, down to the department level. It also provides a visual summary of performance, including trends by month and Key Performance Indicators (KPIs). Use the filter function to specify the information to be displayed in the dashboard.
TIP: The rolling 12-month charts display 13 months of data so that you can compare the current period with the same period last year.
Summary tab
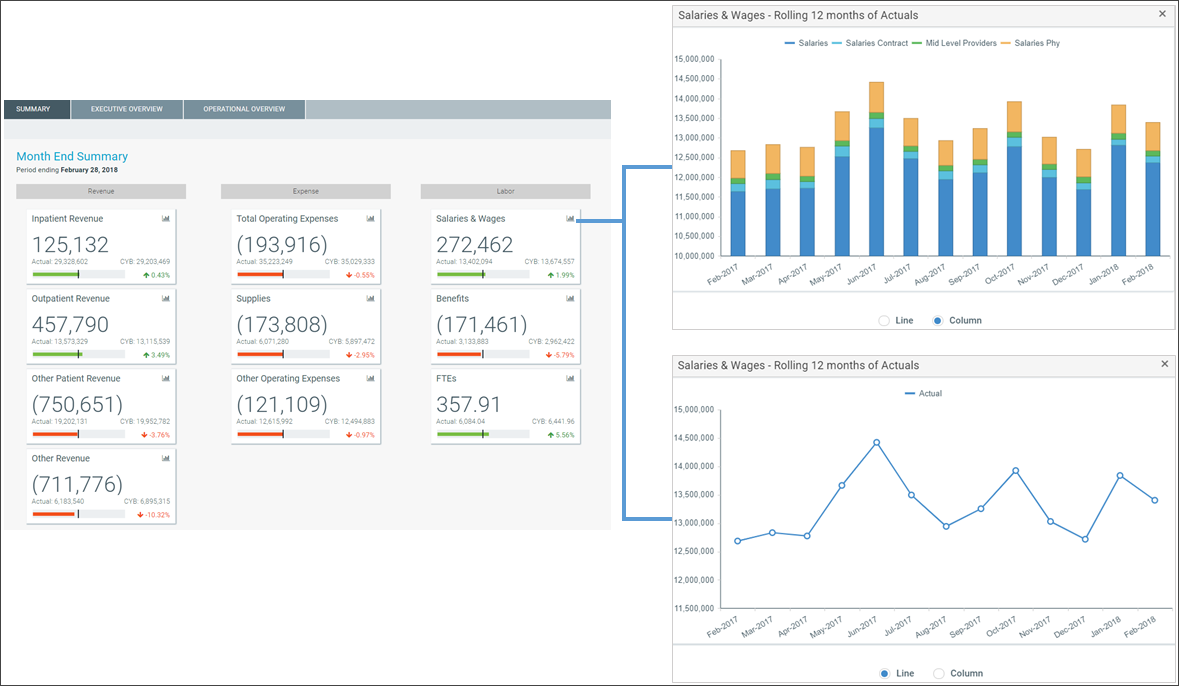
The Summary tab is the first tab that appears in the dashboard. It provides a visual representation of actuals versus target, grouped into Revenue, Labor, and Expense categories. This tab provides KPI visibility into all of your departments for the current period and year.
NOTE: The page includes only the departments you have permissions to view.
To view the statistic and per-unit KPI information at the department-level, go to the Operational Overview tab.
To see a chart of rolling 12 months actuals, click the chart icon in the upper left corner of each box.
Executive Overview tab
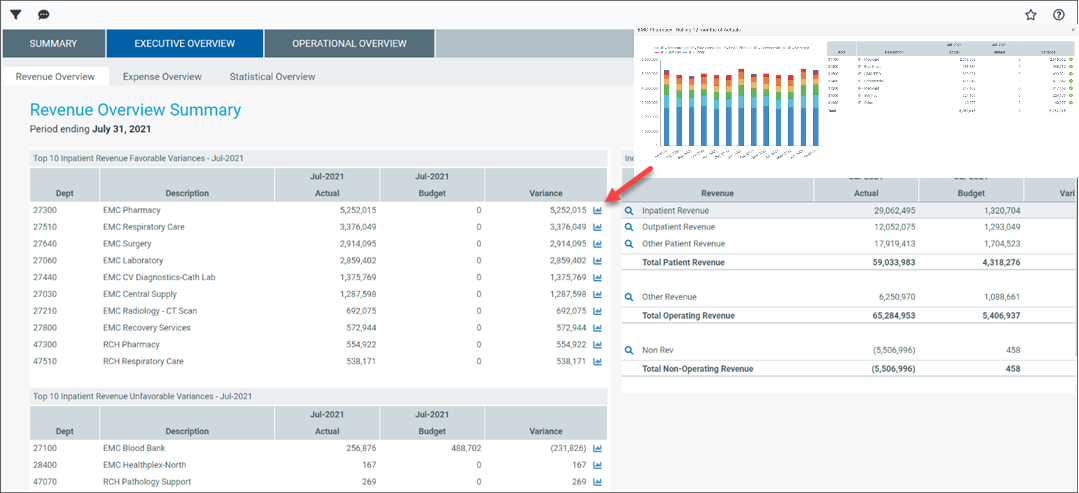
The Executive Overview tab displays summary-level revenue, expense, and statistics information for all the departments in your organization. The default sub-tab on this page is Revenue Overview Summary.
To view a chart of rolling 12-month actuals, click the chart icon in the upper left corner of each box.
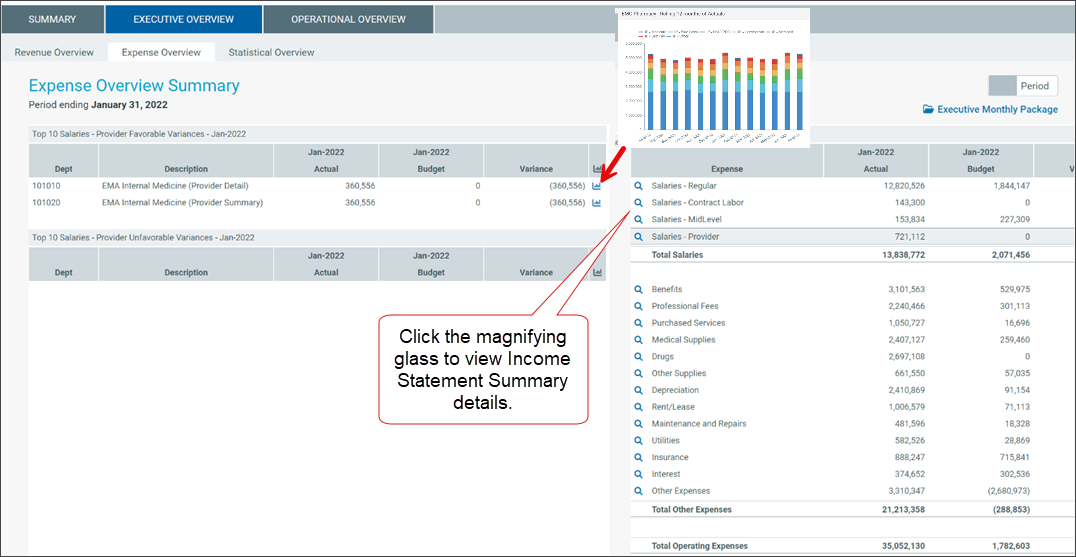
Click the magnifying glass icon to view Income Statement Summary details.
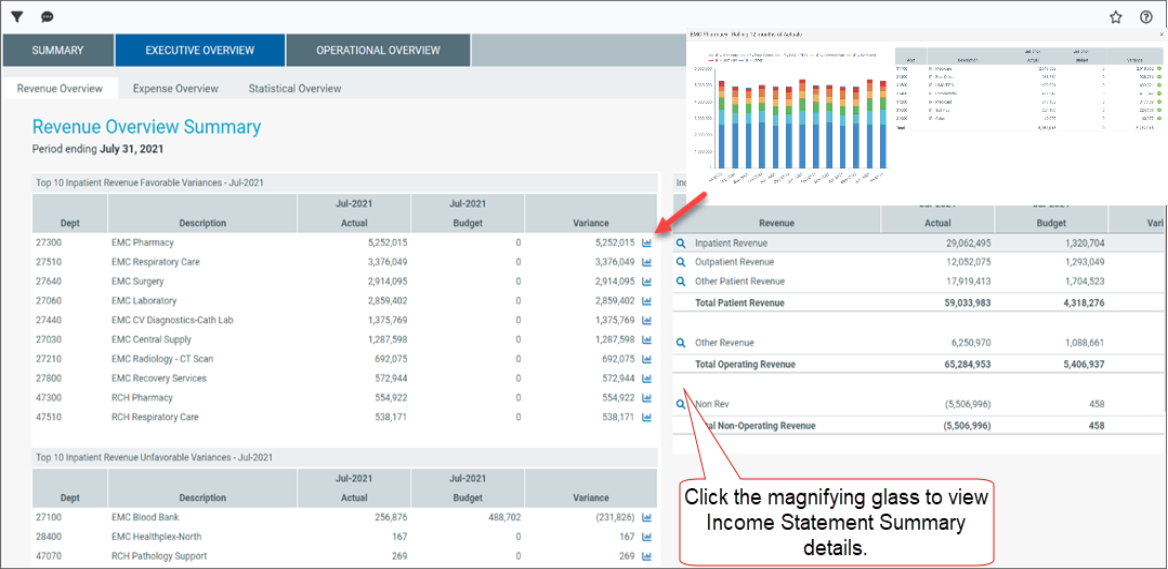
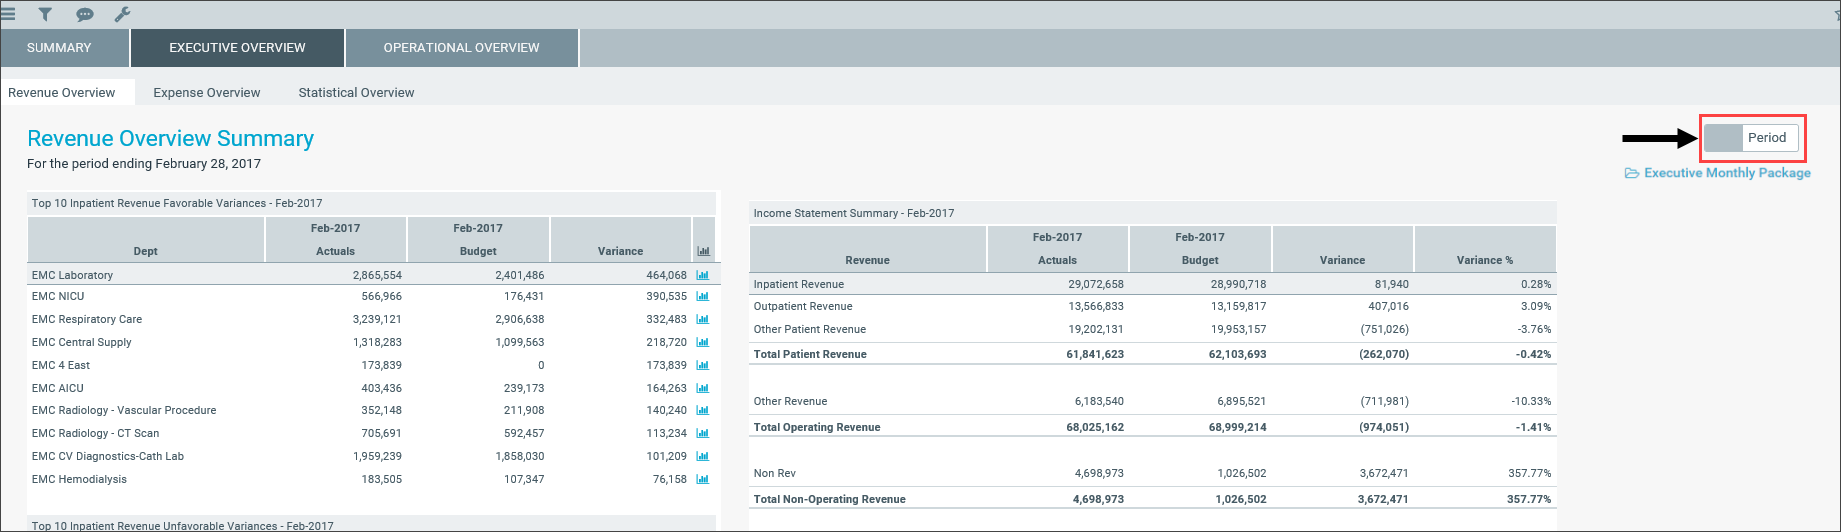
You can also toggle between viewing data for the period or YTD.
Revenue Overview and Expense Overview sub-tabs
The Revenue Overview and Expense Overview sub-tabs work similarly by showing the following sections for revenue and expenses:
-
Income Statement Summary – Shows the actuals, targets, variance, and variance percentage for the following categories:
-
Inpatient revenue
-
Outpatient revenue
-
Other patient revenue
-
Other revenue
-
Non-revenue categories
As you click each category, the Top 10 Favorable and Unfavorable sections list the departments that comprise those values. For example, if you click Inpatient Revenue, the Top 10 Favorable and Unfavorable inpatient departments are displayed.
-
- Top 10 Favorable Variances – Shows the top ten departments with the highest positive variance (actuals minus target) by department, actual, target, and variance.
-
Top 10 Unfavorable Variances - Shows the top ten departments with highest negative variance (actuals minus target) by department, actual, target, and variance.
NOTE: The graphs in the Revenue Overview and Expense Overviews have been limited to showing the Top 20 variance accounts.
For each department in the Top 10 Favorable and Unfavorable sections, click the department chart icon to view a rolling 12 months of actuals, including the actuals, target, and variance listed by account.
Click the magnifying glass icon to view Income Statement Summary details.
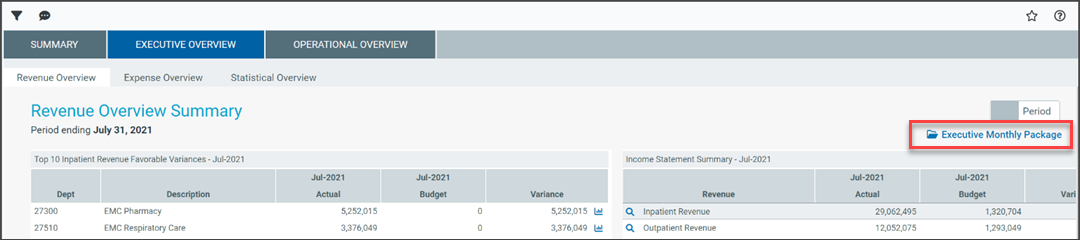
You can also access the Executive Monthly Package from either tab.
Statistical Overview tab
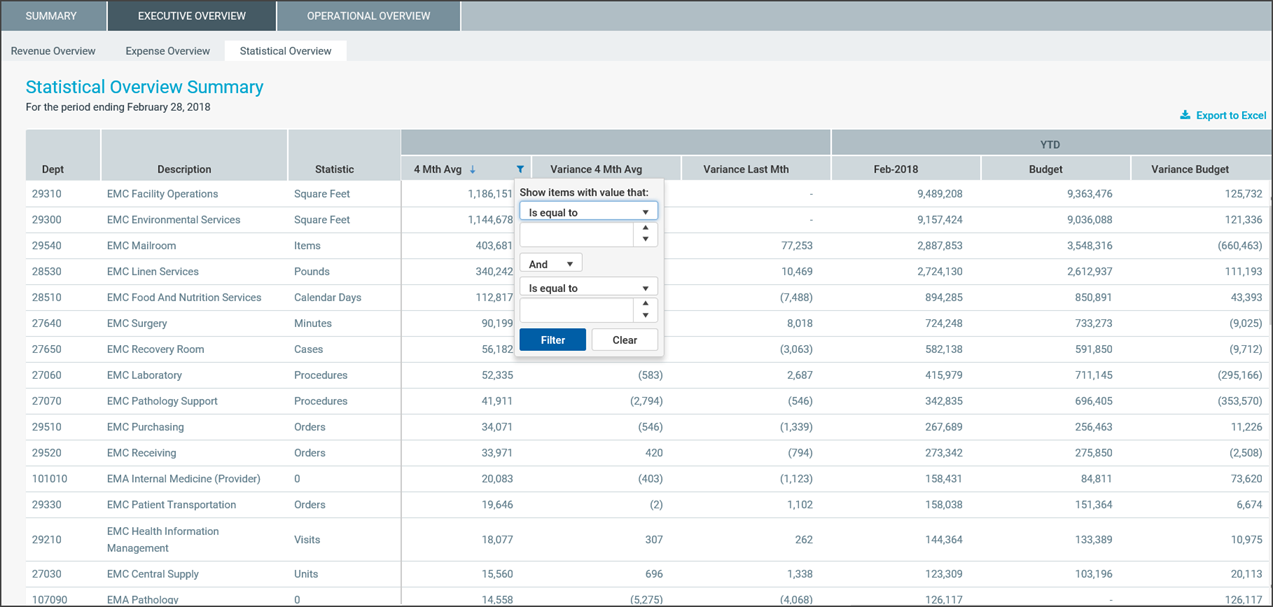
The Statistical Overview tab shows a list of key statistics by department for the selected month and year. This tab shows:
- Prior month, two month, and three month data
- Four month average
- Variance to the prior month
- Variance to the four month average
- Current target (3 Month Average, Last Month, or Same Month Last Year)
- Variance to target
By using the filter function, you can filter the data by:
- Target - Select the target of either Budget, 3 Month Average, Last Month, or Same Month Last Year
- Category - Select VP, Director, Manager, Budget Group, Division, Dept (RPTMap).
- Time Period - Select a month and year.
You can also sort the data by the following columns and export the data to Excel:
-
Variance to Prior Month
-
Variance 4 month Average
-
Variance to Target
Operational Overview tab
Use the Operational Overview tab to view the details regarding how a department is performing by providing data regarding KPIs, patient revenue, expenses, labor, and benefits.
The Operational Overview tab includes the following sub-tabs:
-
KPI tab
-
Patient Revenue tab
-
Other Revenue tab
-
Labor tab
-
Benefits tab
-
Other Expenses tab
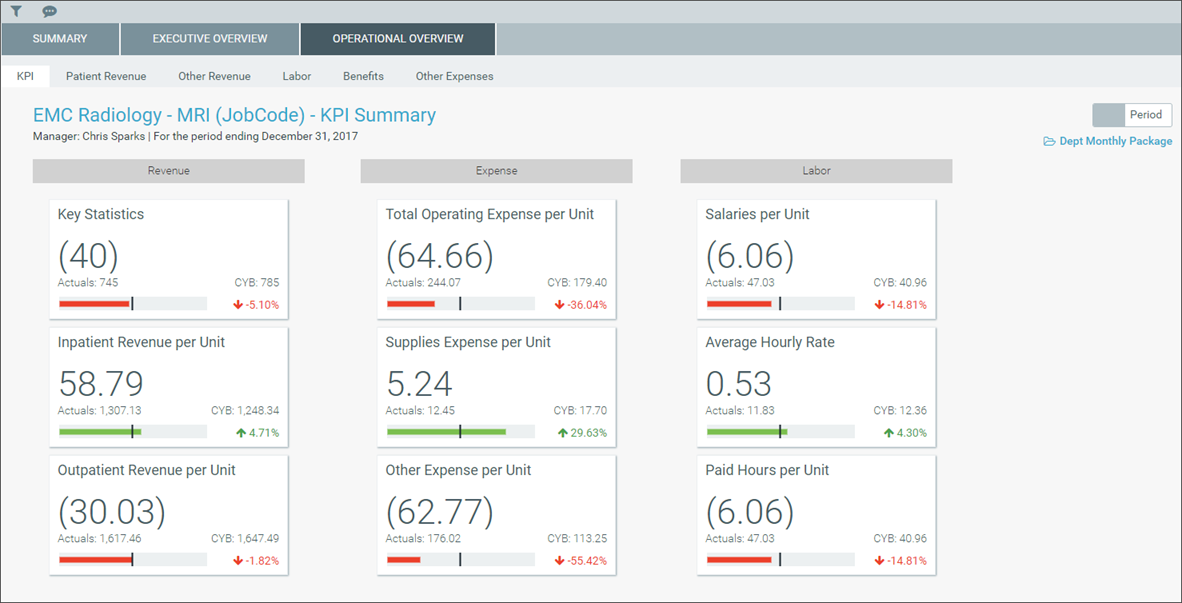
KPI tab
The KPI tab shows a visual representation of actuals versus target, grouped into Revenue, Labor, and Expense categories. This tab provides KPI visibility into a department for the current period and year. You can also access the Dept Monthly Package from this tab.
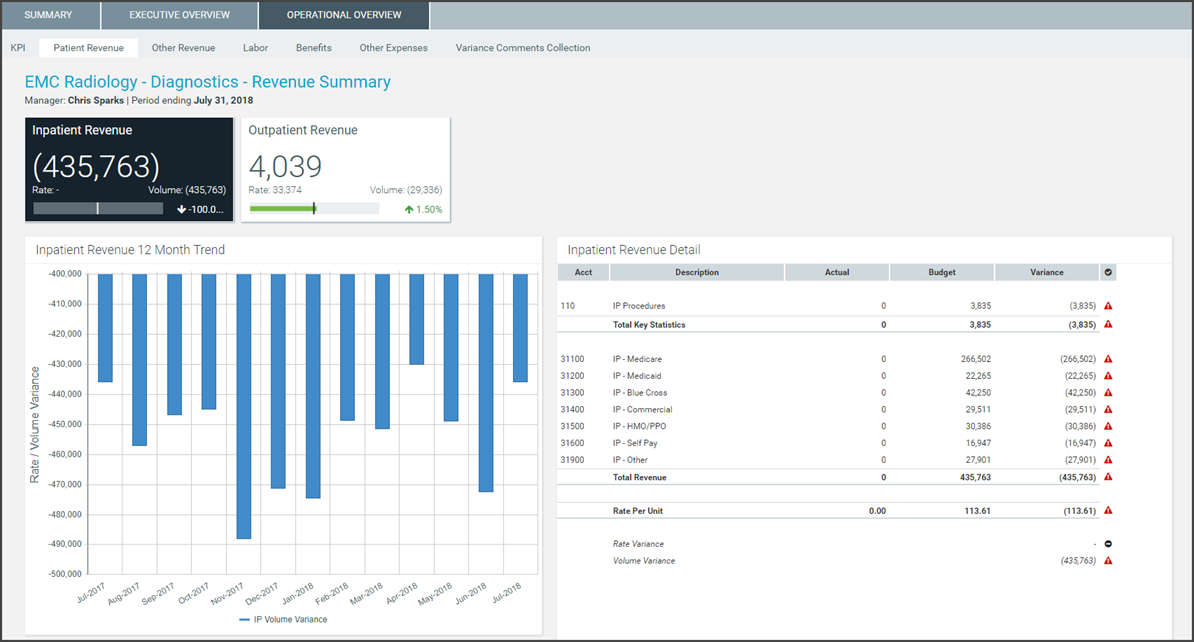
Patient Revenue tab
The Revenue tab displays inpatient and outpatient revenue, which is broken out by rate and volume variance.
To view the 12-month revenue trend and details, click the Inpatient Revenue and Outpatient Revenue boxes.
To view actuals for the period or Year to Date, click the Period/YTD toggle in the upper right corner of the page.
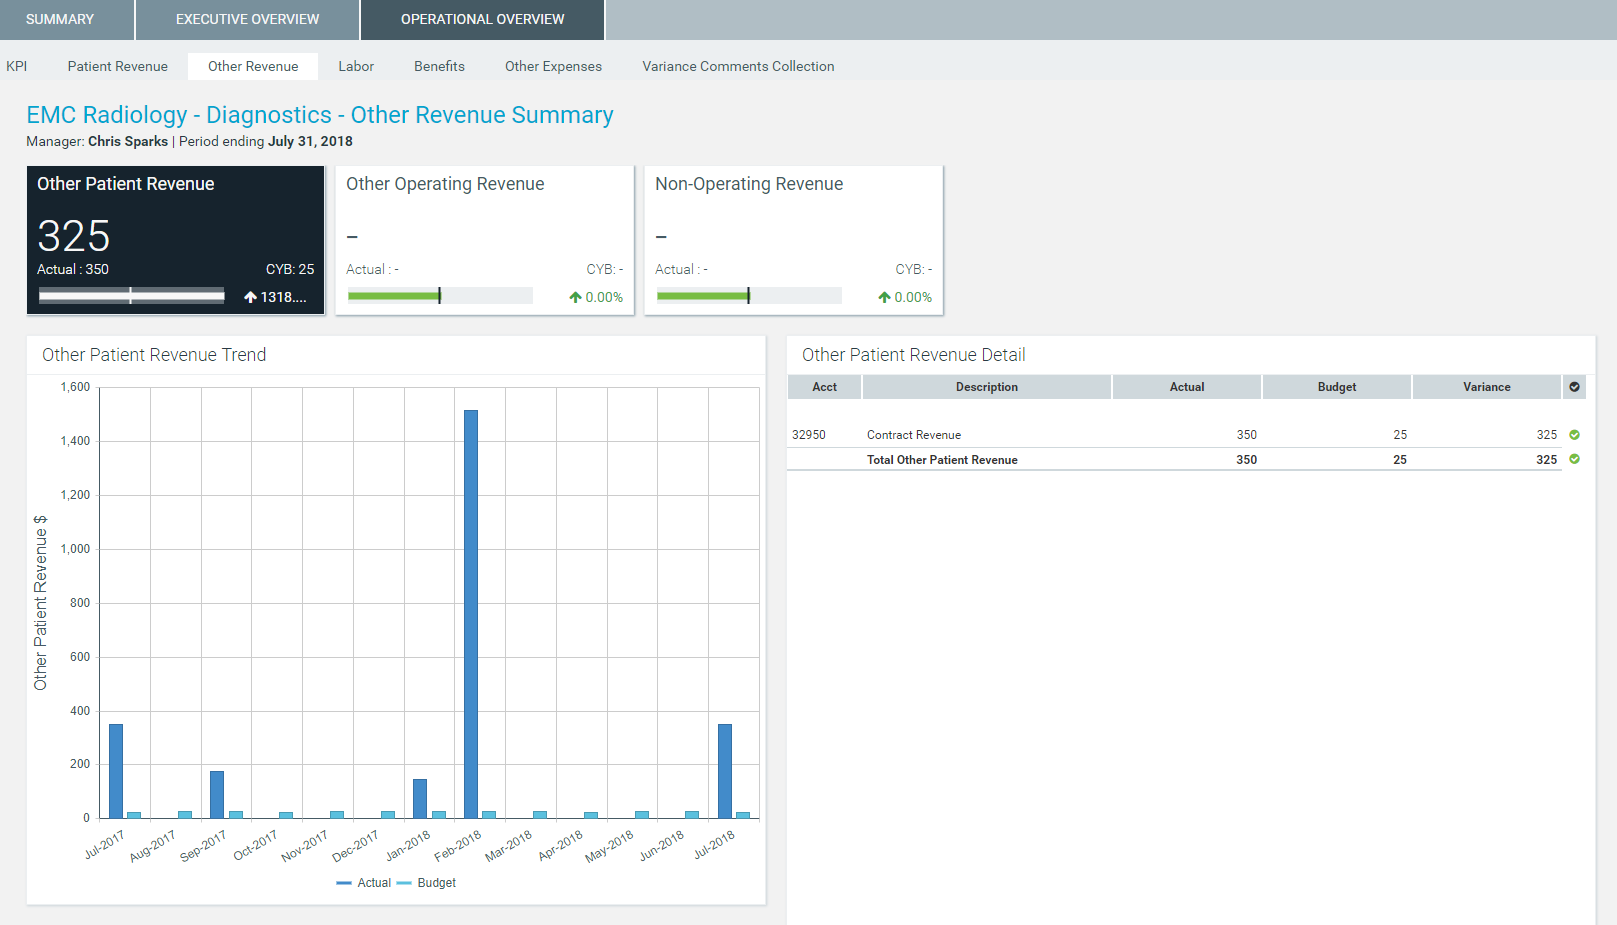
Other Revenue tab
The Other Revenue tab displays other patient, operating, and non-operating revenue. Click the boxes to view the 12-month revenue trend for the associated revenue category.
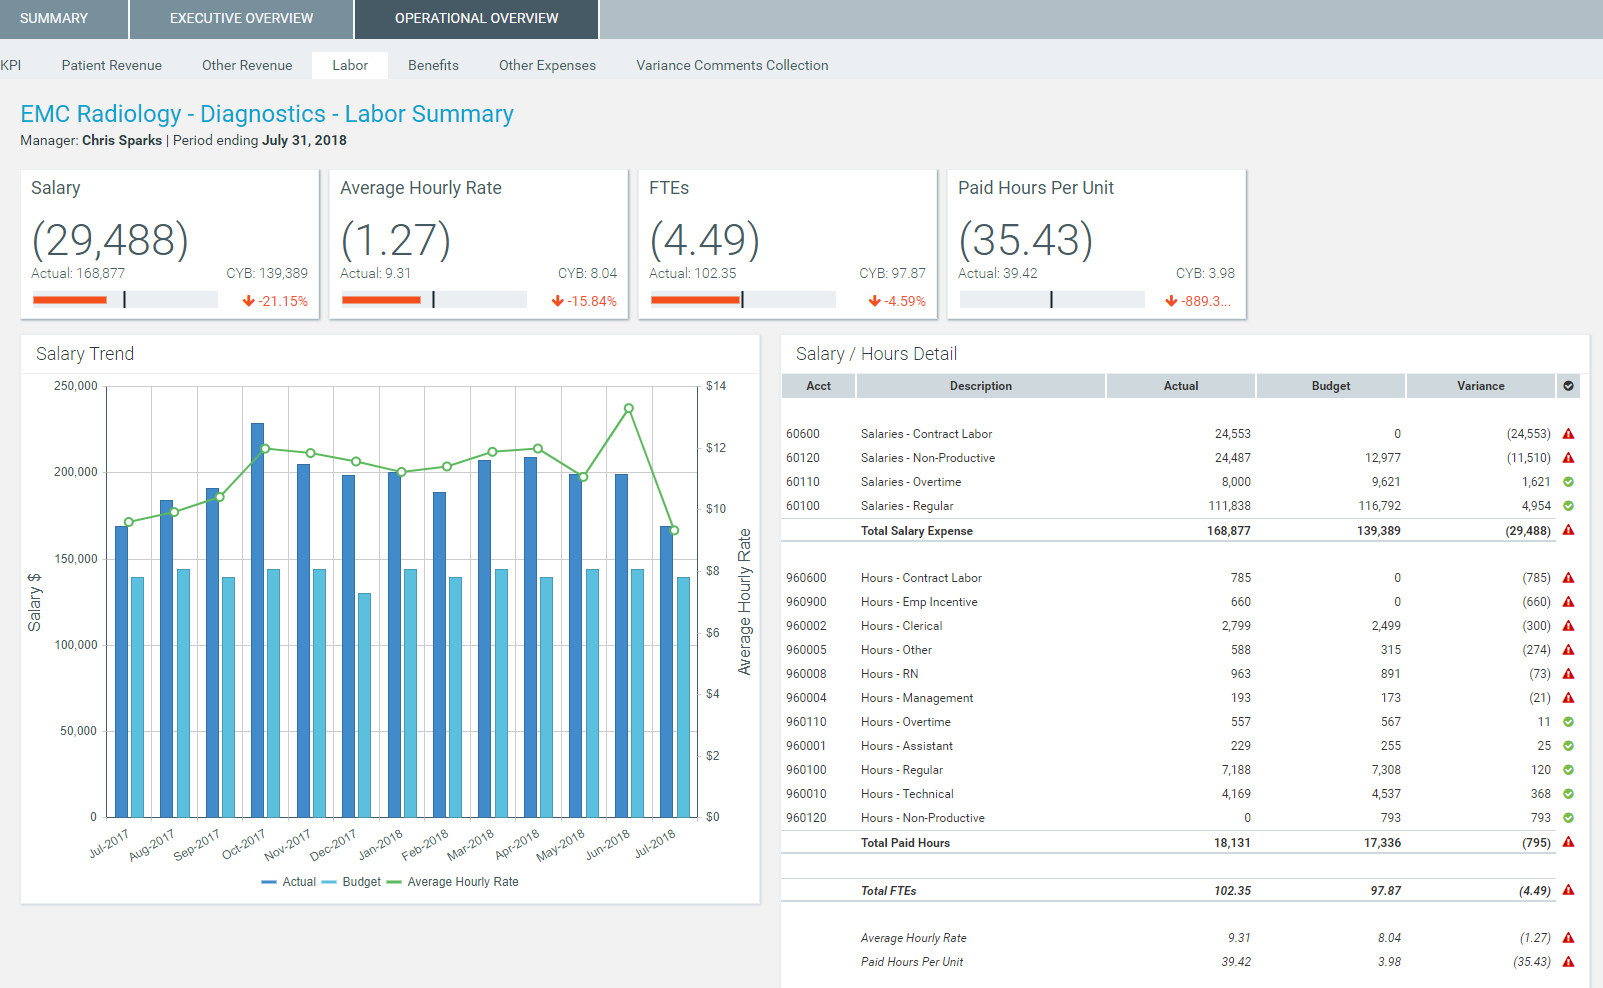
Labor tab
The Labor tab shows an overview of labor expenses excluding benefits. This tab displays the following information:SalariesAverage hourly rateFTEsPaid hours per unitSalary and hour detailsKPIs
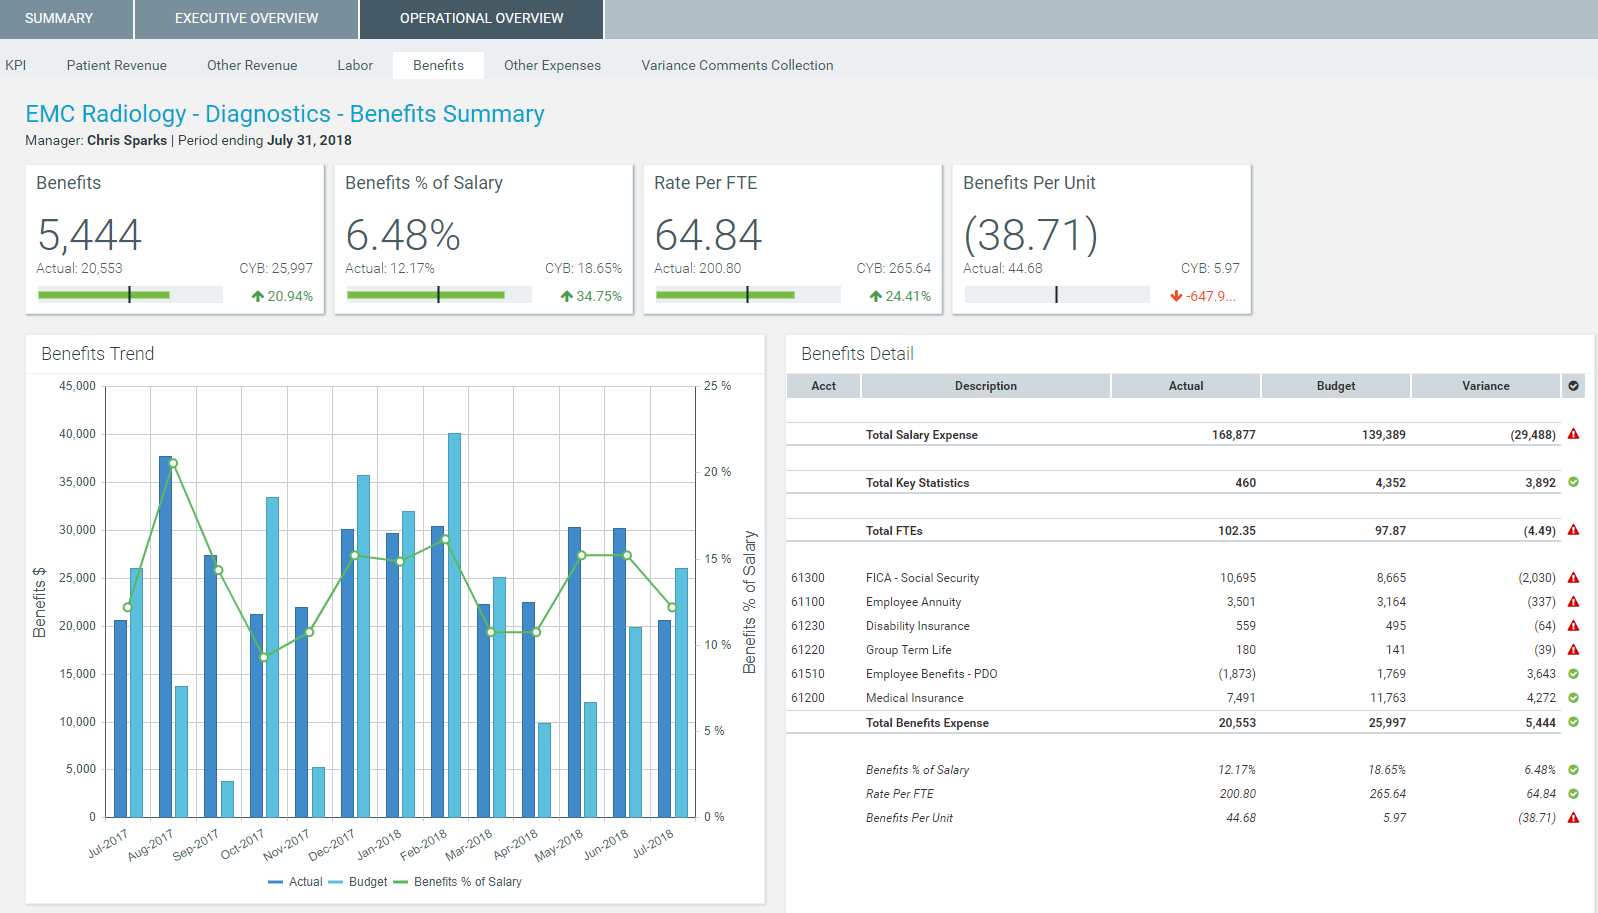
Benefits tab
The Benefits tab shows the following benefit information:BenefitsPercentage of salariesRate per FTEBenefits per unitDetails by benefit typeKPIs
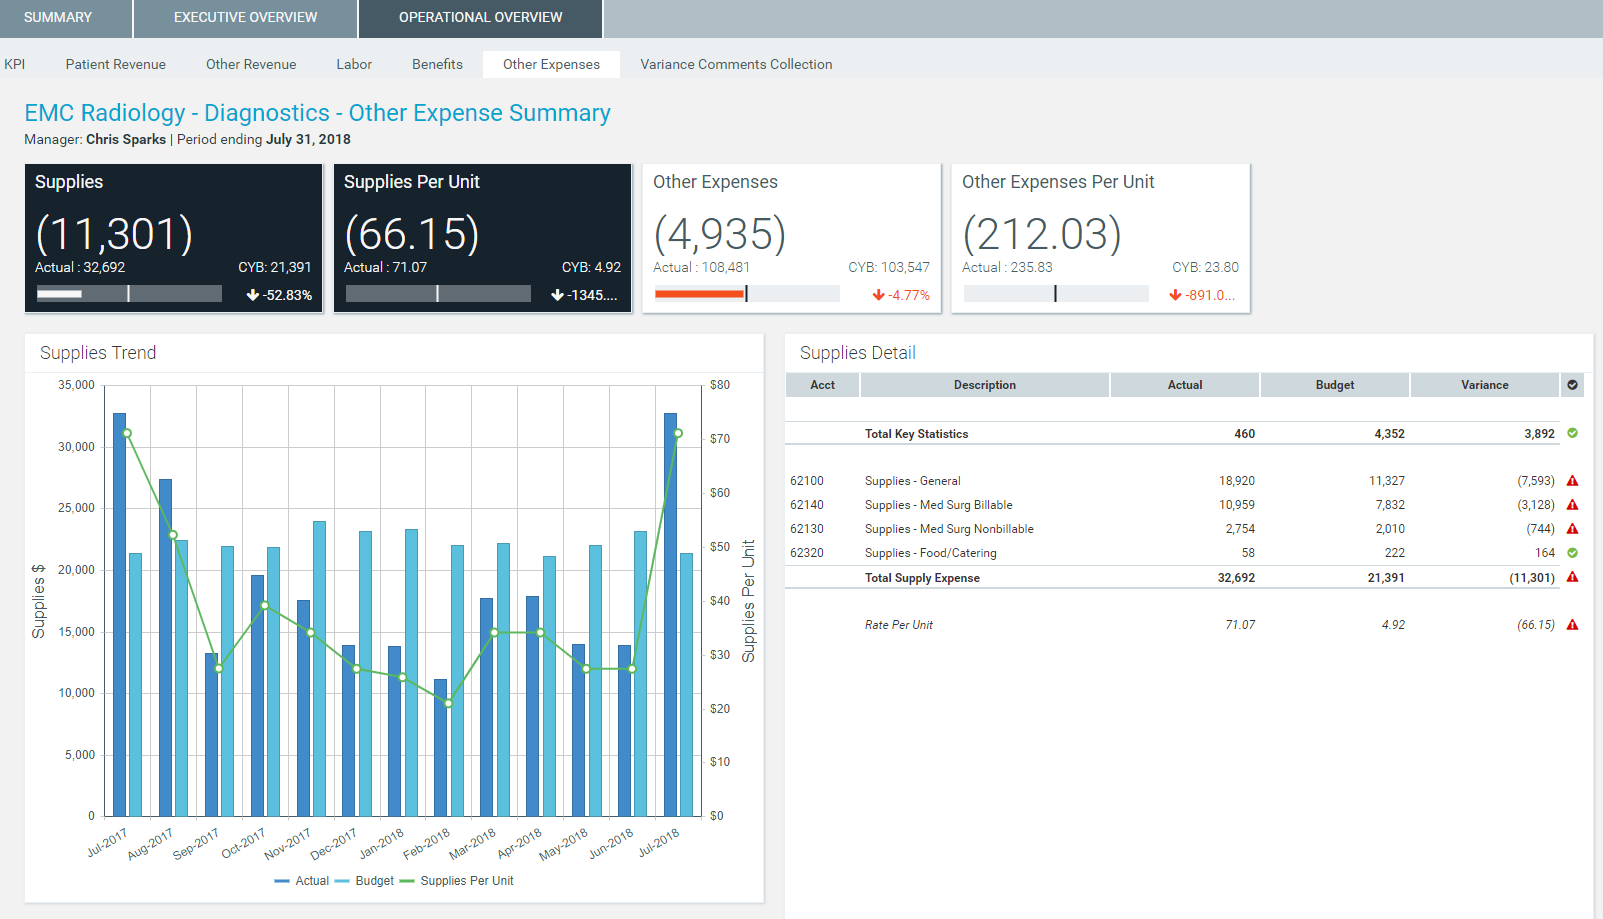
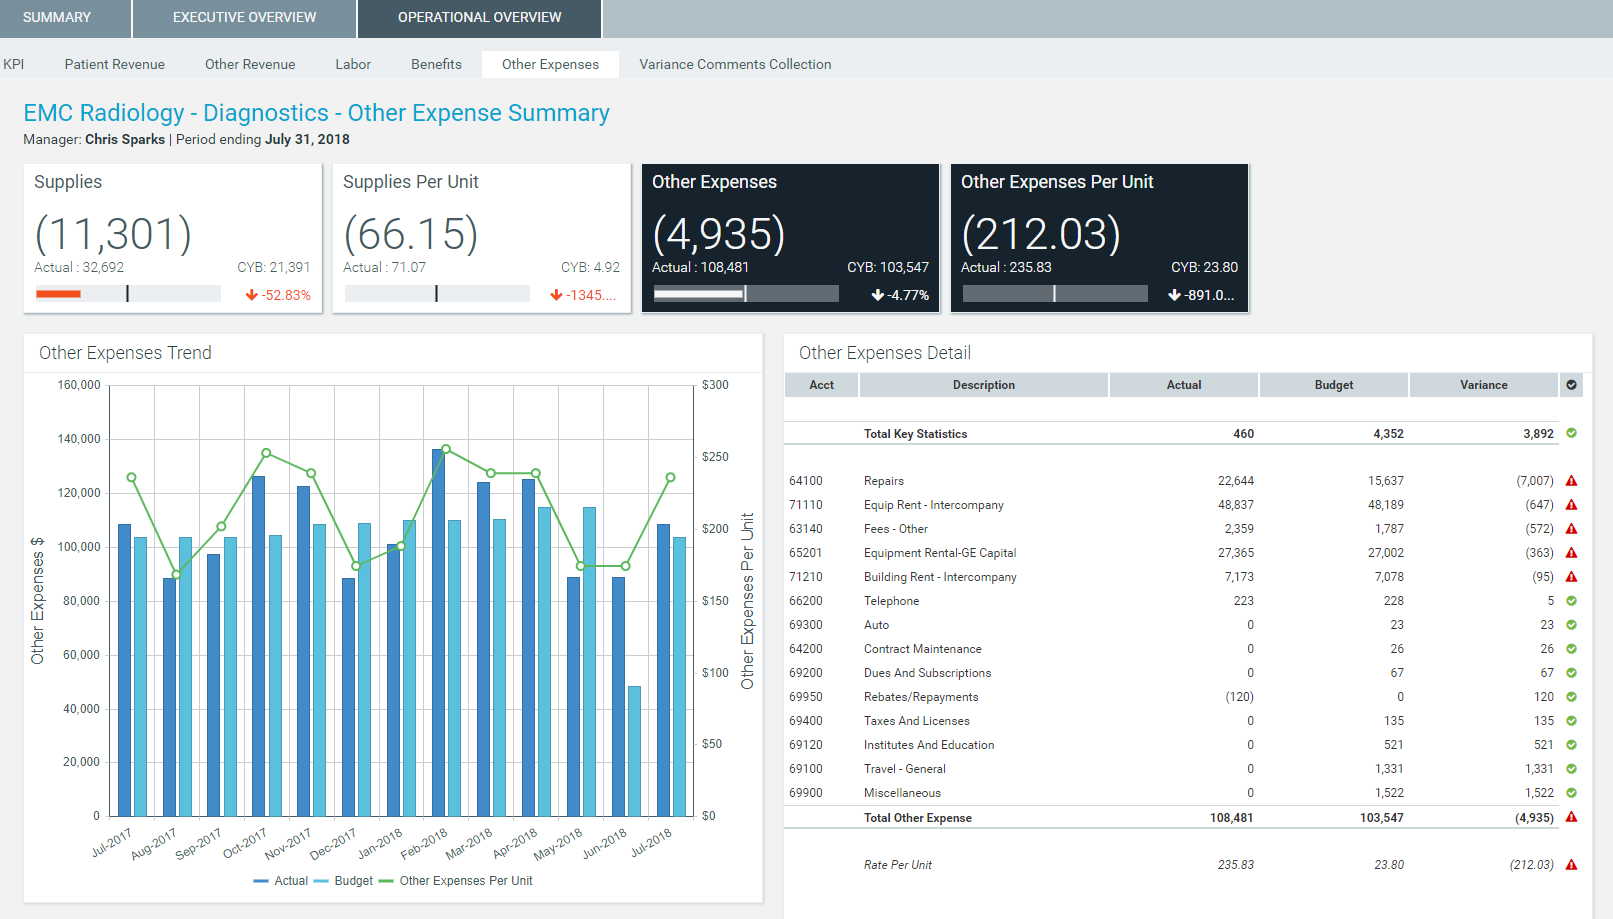
Other Expenses tab
Supplies view
Other Expenses view
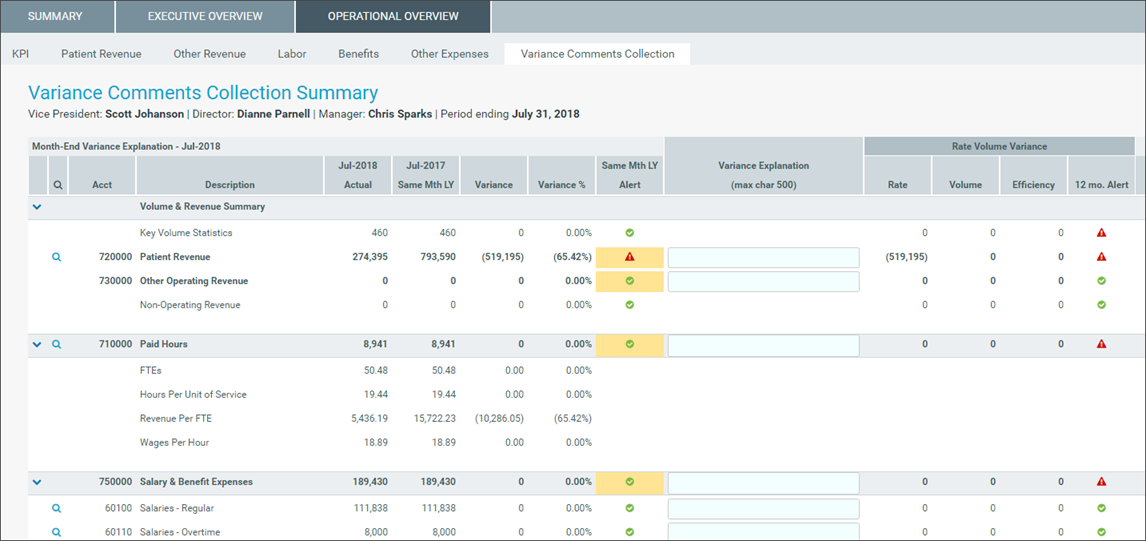
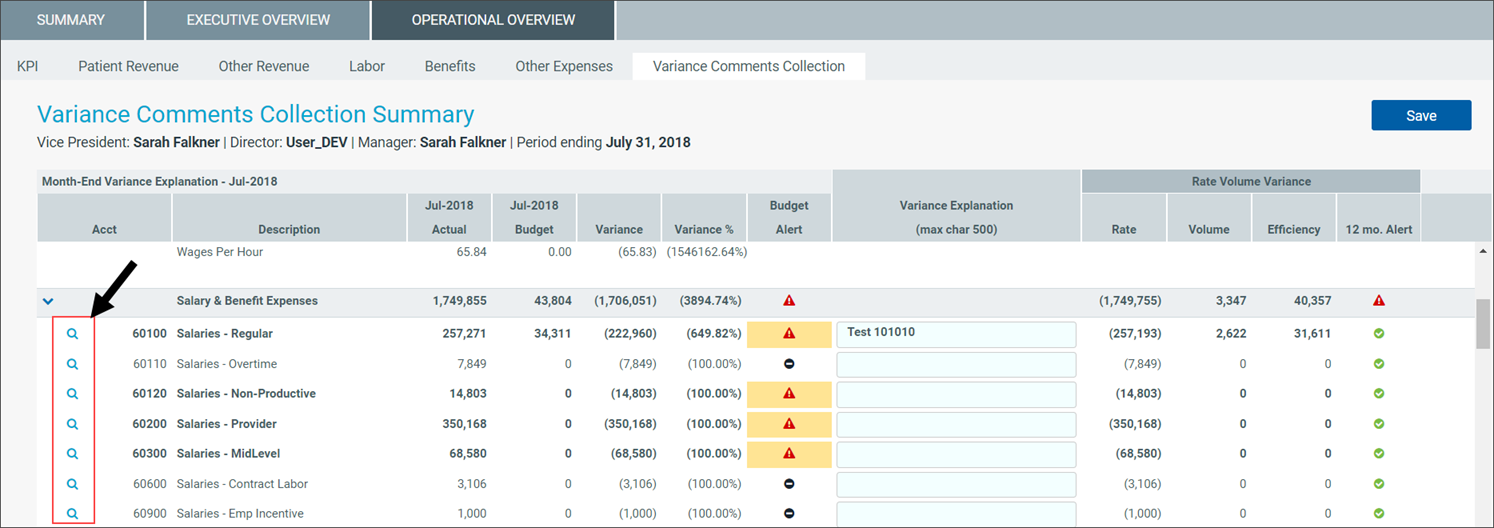
Variance Comments Collection
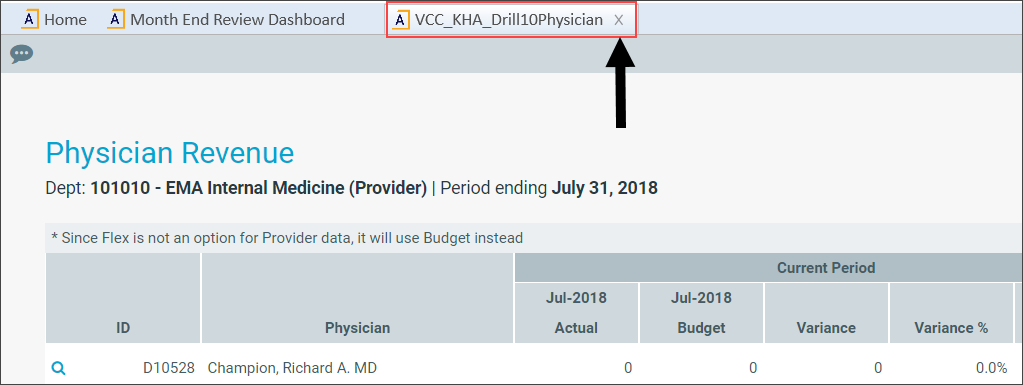
Drill data
Some line items display a magnifying glass icon, which indicates that you can drill for more information regarding that line item. Some drills include multiple layers of drills, depending on the types of data available.
To open a drill, double-click the magnifying glass. The system opens a separate tab with the drill information. Click X in the tab to close the drill.